An MSSP system includes MSSP servers and databases and connections to external components (such as OTA servers). Administrators need to see what’s going on in the system.
Monitori ng is used to view system state and state history:
- Component states (on/off).
- System performance.
- Anomalies in the system.
How to monitor an MSSP system? We decided to take a look!
Monitoring products
Our goal was to find a monitoring product that can present monitoring information in a digestible way. Our MSSPs provide monitoring data with SNMP and JMX protocols.
We first looked at a software called Nagios. This product is very versatile but has an extremely steep learning course. Nagios is more like a framework without too much out-of-the-box functionality. For some this could be manageable, but since we want to provide an easily manageable monitoring to our customers, we decided to look elsewhere. It would have taken too much time to implement a full monitoring system with Nagios.
Next we moved to Zabbix which is a more complete solution. Monitoring data from JMX and SNMP traps was a bit difficult to setup. After the hurdles with the setup, we were able to quickly create a comprehensive monitoring tool with Zabbix. There are good initial samples for JMX and SNMP monitoring and a template system that helps to separate monitoring configurations. This is clearly a good choice for us because of good SNMP and JMX monitoring support and a template system that makes providing configurations to our customers easy.
Drawing graphs easily is one of the best features of Zabbix. Nagios isn’t user friendly with graphs. There are other products that are good with drawing graphs but they fall short with generating alerts from monitoring data. More about graphs and alerts in the next chapter.
Zabbix monitoring
Now we have a Zabbix system all set up and ready to go. We gather monitoring data from our development MSSP system. Our MSSP servers provide data about their connections to other MSSPs, databases and external systems.
Zabbix provides a system to add triggers for data changes. For example the following events can fire a trigger:
- Server goes down and sends an SNMP trap.
- Too many transactions fail.
- Vague indicators like high memory usage or high CPU usage.
When a trigger is fired an alert is shown on the dashboard page. The dashboard page:
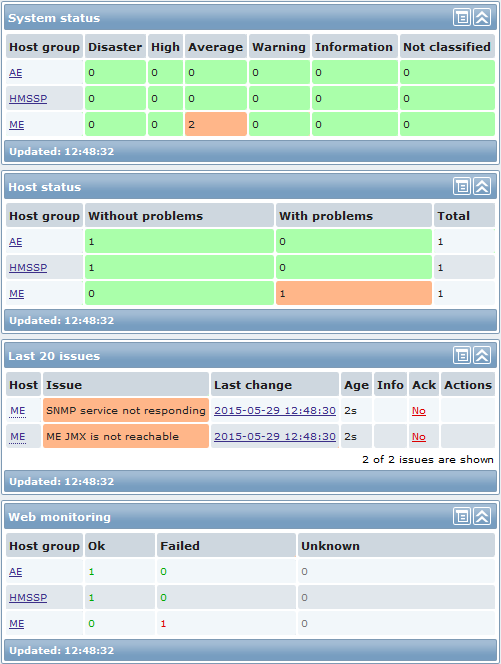
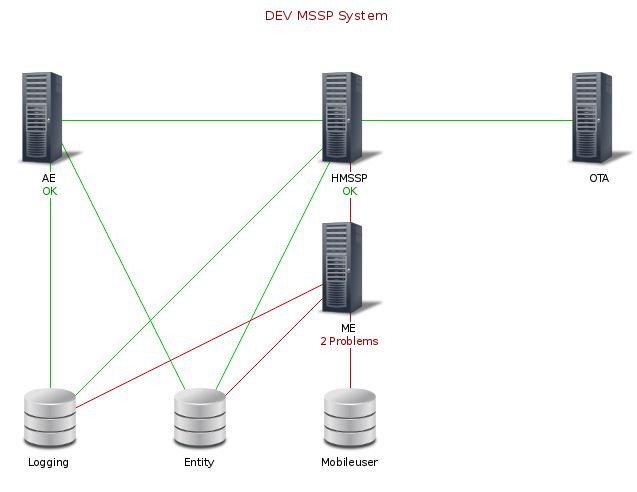
We used Zabbix to draw a map where we inserted our servers and databases. We drew all the relevant connections in the system. The color of connection lines are changed based on alerts. The map:
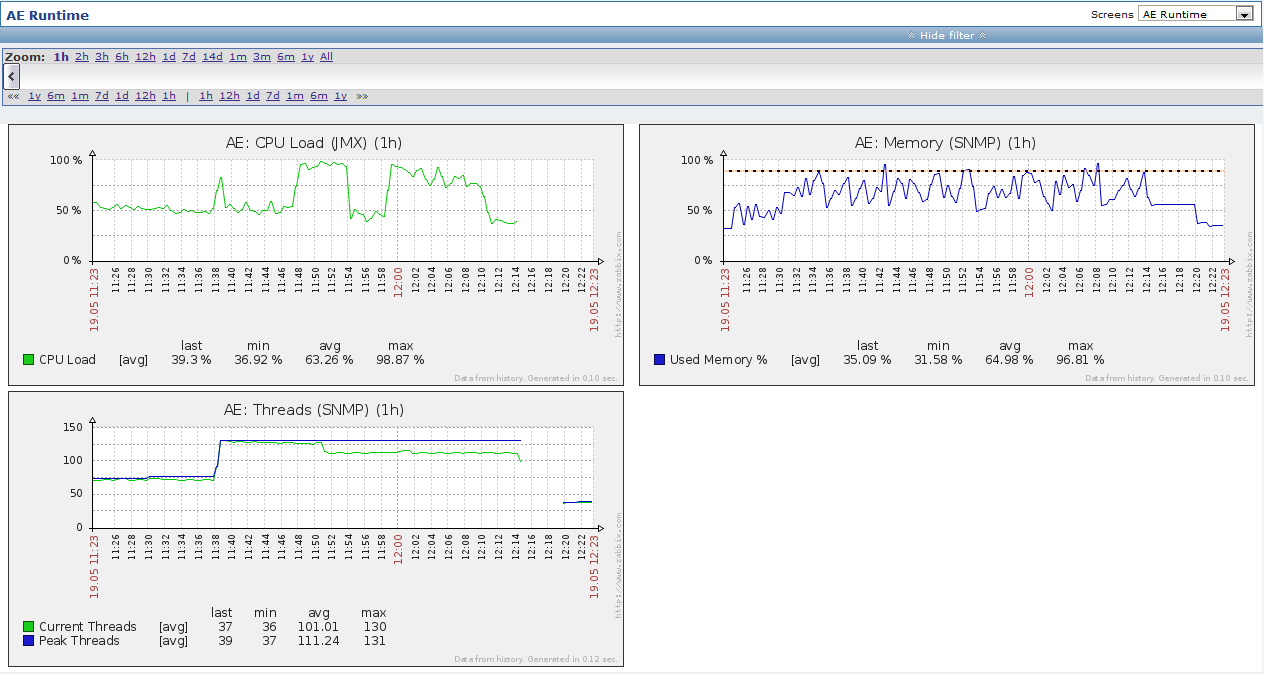
Screens are used to show different data like graphs and maps on a single page. The following screen includes graphs with AE server’s runtime monitoring data. Also notice the Memory graph which shows “90% memory usage” trap.
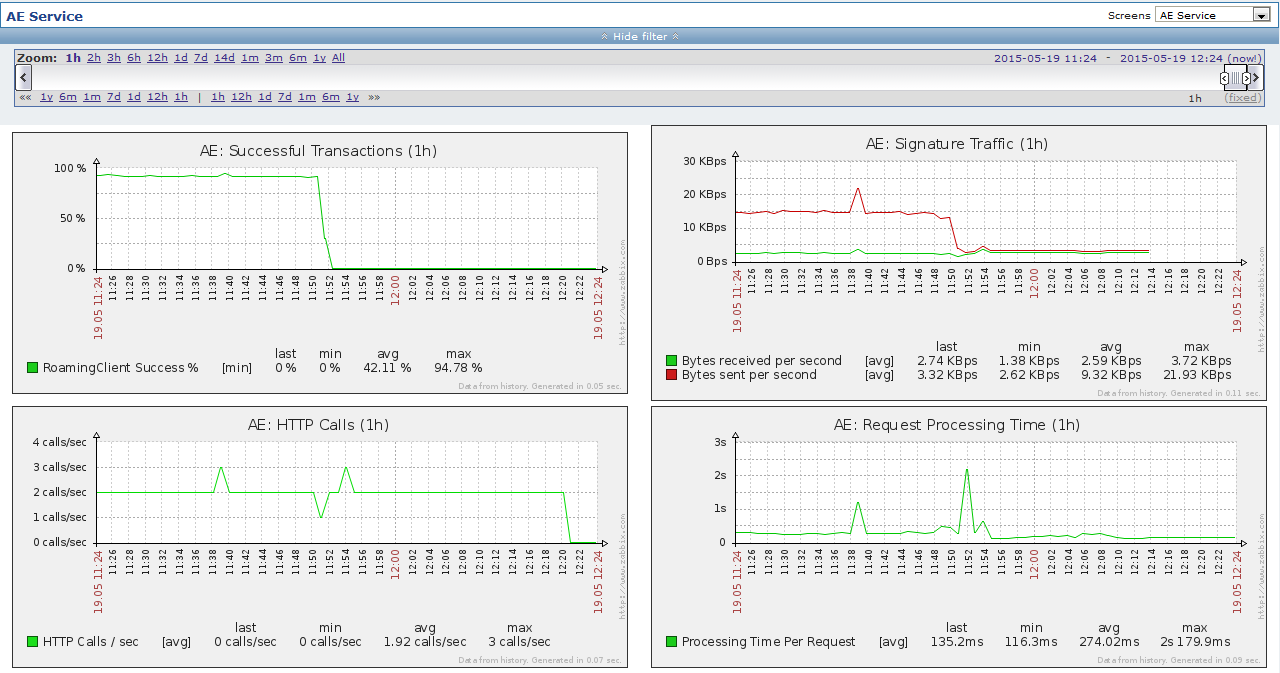
We made another screen for viewing AE server’s service monitoring data:
In conclusion, monitoring data that our MSSP system provides has improved during this exercise. Previously we hadn’t attempted to display our monitoring data in a way that’s meaningful for administration. Displaying the data in Zabbix helped us to provide comprehensive monitoring data.
For more information about Kiuru MSSP monitoring see this presentation.